
UPSC Success Rate Analysis 2026 Updates: The UPSC Civil Services Examination is frequently called the Mother of All Exams and the numbers justify that title completely. Of every 1,000 candidates who register for UPSC only approximately 1 is finally recommended for a civil service. This article presents the most comprehensive data backed analysis of UPSC success rates available covering stage wise attrition year wise trends attempt statistics age analysis gender data educational background optional subject trends and state wise performance to give every UPSC aspirant an honest picture of what they are up against and what the data says about how to beat the odds.
The UPSC Selection Funnel How Brutal Is It Really?
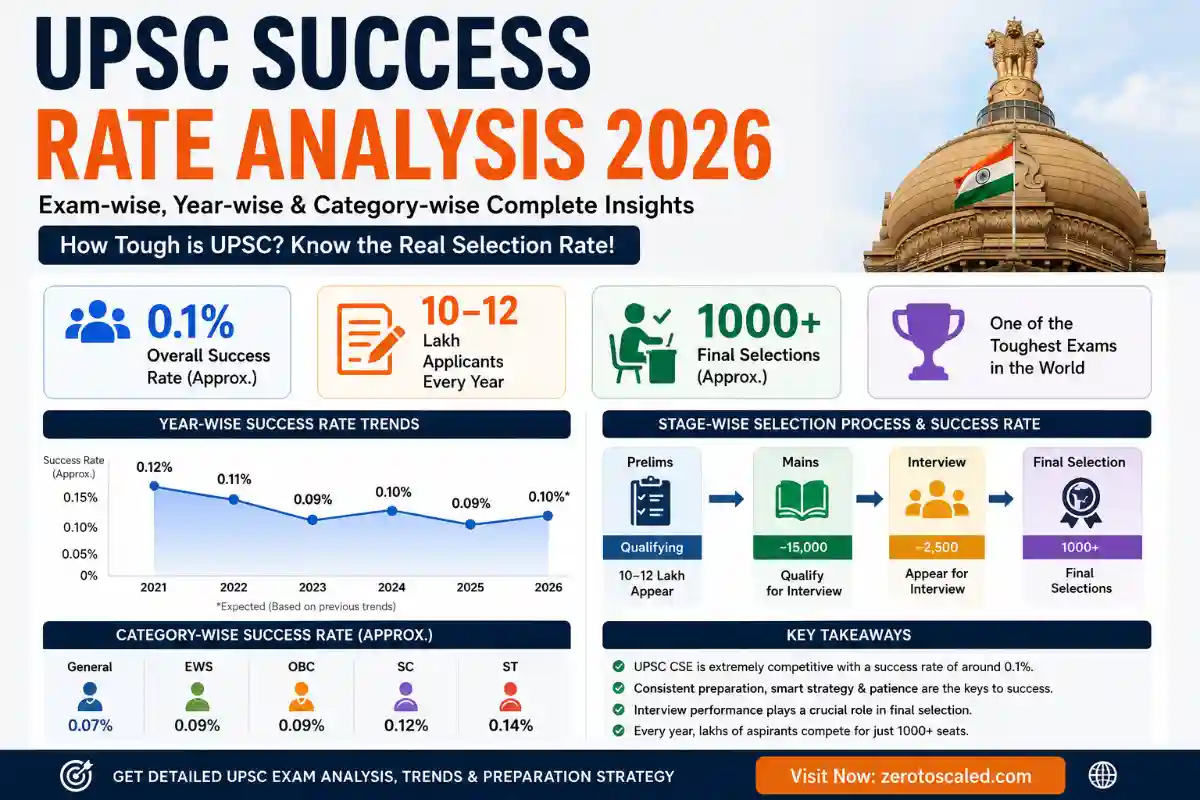
UPSC Success Rate Analysis 2026: The UPSC CSE selection process involves three stages Preliminary examination objective Mains examination written and Personality Test interview. Each stage is eliminatory.
Here is the complete funnel for UPSC CSE 2026 Prelims result declared June 15, 2026
| Stage | Candidates | % of Previous Stage | % of Appeared |
|---|---|---|---|
| Registered | 8,19,000 | — | — |
| Appeared for Prelims | 5,49,000 | 67% of registered | 100% |
| Qualified for Mains | 13,343 | 2.43% of appeared | 2.43% |
| Called for Interview (est.) | 3,000 | 22% of Mains | 0.55% |
| Finally Selected (est.) | 1,016 | 34% of interviewed | 0.18% |
The brutal reality in plain numbers
- Of every 100 people who register → 67 actually appear
- Of those 67 who appear → only 1.6 clear Prelims
- Of those 1.6 → only 0.37 clear Mains
- Of those 0.37 → only 0.12 make the final cut
Translation: Of every 1,000 who register approximately 1 gets selected. Only 7% of candidates succeed in their first attempt while 93% require multiple attempts.
Also Read: JEE Advanced Cutoff 2026: Category-Wise Qualifying Marks, Safe Score & IIT Admission Analysis
Year Wise UPSC Success Data 2019 to 2026
UPSC result over the last 10 years shows intense competition with only 700–1,100 candidates selected each year out of 10–13 lakh applicants making the pass percentage just 0.1%–0.2%.
| Year | Registered | Appeared (Prelims) | Mains Qualified | Final Selected | Vacancies | Success Rate |
|---|---|---|---|---|---|---|
| 2026 | 8,19,000 | 5,49,000 | 13,343 | 1,016 | 1,016 | 0.18% |
| 2025 | 11,22,000 | 5,85,000 | 14,000 | 1,009 | 1,009 | 0.17% |
| 2024 | 13,40,000 | 6,53,000 | 14,627 | 1,056 | 1,056 | 0.16% |
| 2023 | 13,07,216 | 5,77,565 | 14,624 | 1,016 | 1,016 | 0.18% |
| 2022 | 11,52,000 | 5,20,000 | 13,090 | 861 | 861 | 0.17% |
| 2021 | 10,93,000 | 5,58,000 | 10,000 | 712 | 712 | 0.13% |
| 2020 | 10,58,000 | 4,76,000 | 10,530 | 796 | 796 | 0.17% |
| 2019 | 9,32,000 | 5,12,000 | 11,845 | 829 | 829 | 0.16% |
Key trend: Approximately 4.5 to 5.8 lakh candidates appear in the UPSC CSE Preliminary examination each year though many more register. Roughly 50–60% of registered candidates never appear often due to inadequate preparation or change of plans.
Stage Wise Success Rates Where Candidates Drop Out
Stage 1 Registration to Appearance 33% drop out
Every year a third of registered candidates never appear for Prelims. In 2023, 13,07,216 candidates registered but only 5,77,565 (44%) actually appeared. Reasons include:
- Inadequate preparation
- Change of career plans
- Work/personal commitments
- Strategic withdrawal to avoid using up an attempt
Stage 2 — Prelims 97% elimination
97 candidates out of the 100 who write the preliminary exams may not pass. The Prelims cutoff for General category has ranged from 75 to 110 marks out of 200 in recent years.
| Year | Appeared (Prelims) | Qualified (Mains) | Prelims Success Rate |
|---|---|---|---|
| 2026 | 5,49,000 | 13,343 | 2.43% |
| 2024 | 6,53,000 | 14,627 | 2.24% |
| 2023 | 5,77,565 | 14,624 | 2.53% |
| 2022 | 5,20,000 | 13,090 | 2.52% |
Stage 3 Mains 80% elimination
Of those who clear Prelims and appear for the 9-paper Mains examination approximately 20% are called for the Interview. Of Mains candidates roughly 2,845 were called for the Personality Test in 2024 from 14,627 who cleared Prelims.
| Year | Mains Appeared | Called for Interview | Mains Success Rate |
|---|---|---|---|
| 2024 | 14,627 | 2,845 | 19.45% |
| 2023 | 14,624 | 2,906 | 19.87% |
| 2022 | 13,090 | 2,500 | 19.10% |
Stage 4 Interview 35% elimination
The Interview Personality Test carries 275 marks out of the 2,025 total. Only about 35% of those interviewed don’t make the final cut the Interview is the least eliminatory stage. However the marks can swing a candidate’s final rank significantly.
Also Read: WBJEE Result 2026 Out: Check Rank Card, Direct Link, Merit List, Counselling and Full Update
Attempt Wise Success Rate The Most Surprising Data
Of 1,020 candidates selected only 6.2% cleared UPSC on their first attempt while 22% succeeded on the fourth.
| Attempt Number | % of Selected Candidates | Key Insight |
|---|---|---|
| 1st attempt | 6.2% | Very few win on first try |
| 2nd attempt | 14% | Improvement phase |
| 3rd attempt | 20% | Near-peak success rate |
| 4th attempt | 22% | Highest success rate |
| 5th attempt | 18% | Still productive |
| 6th attempt | 10% | Last attempt for General |
Critical insight: The 4th attempt produces the highest success rate. Before 2014 most candidates cleared the exam in 2–3 attempts. Today the average has increased to 3–4 attempts.
This data has profound implications
- A first attempt failure is completely normal 93.8% of successful IAS officers also failed their first attempt
- Persistence is the most underrated strategy in civil services preparation
- The 3rd and 4th attempts represent the sweet spot where accumulated knowledge peaks while attempts still remain
Age Wise Success Rate When Do Candidates Win?
The highest selection rate is in the 24–26 age group.
| Age Group | Success Pattern | Notes |
|---|---|---|
| 21–23 | Low | Usually 1st or 2nd attempt |
| 24–26 | Highest | Peak success rate |
| 27–29 | High | Experienced candidates |
| 30–32 | Moderate | Final attempts for Gen |
Why 24–26 wins: Most candidates who peak at this age began preparation at 21–22 after graduation. By 24–26 they have completed 2–3 attempts accumulated the breadth of General Studies knowledge UPSC tests and developed the answer writing skills Mains demands.
The age limit debate: For many clearing the exam takes 6 or more years of effort often at the cost of career opportunities and mental well being. The maximum age limit 32 for General 35 for OBC 37 for SC/ST ensures candidates don’t start their career too late but critics argue the 6 attempt system effectively forces candidates to begin at 21 to maximise their window.
Also Read: ICAI CA Final May 2026 Result Declared Today: Download Scorecard at caresults.icai.org, Pass % & Toppers List
Gender-Wise Success Rate Women Outperform Men
Although 34.4% of final selections were women female success rates in the optimal age band 31.9% outperformed males 27.1% a 4.8 percentage point advantage.
| Gender | Success Rate (Peak Age Band) | % of Final Selections |
|---|---|---|
| Female | 31.9% | 34.4% |
| Male | 27.1% | 65.6% |
Women outperform men in success rate despite being a smaller percentage of total candidates. This mirrors the trend seen in JEE Advanced female topper achieved higher percentile than expected and NEET where female candidates increasingly dominate top ranks.
Female toppers recent years
- 2022: Ishita Kishore (AIR 1) top 4 ranks all women
- 2021: Shruti Sharma (AIR 1)
- 2025: Anuj Agnihotri AIR 1 Rajasthan but female performance remains strong
Educational Background of Successful Candidates
75% of selected candidates 765 of 1,020 are graduates. 25% 255 are postgraduates. A PG is NOT a prerequisite.
| Qualification | % of Selected Candidates |
|---|---|
| Graduates | 75% |
| Postgraduates | 25% |
Stream-wise background: 71% of selected candidates come from Science Engineering or Medical backgrounds. Only 29% from Arts & Commerce.
| Background | % of Selected | Key Reason |
|---|---|---|
| Science/Engineering/Medical | 71% | CSAT advantage, analytical thinking |
| Arts/Humanities/Commerce | 29% | Optional subject advantage |
The tripling of science engineering and medical candidates since 2011 the year CSAT was introduced in the Prelims. Before CSAT humanities and science backgrounds were roughly balanced. Post-2011 the Science Engineering-Medical (SEM) bloc pulled ahead and never looked back.
Also Read: NEET UG 2025 Result: Mahesh Kumar AIR 1 (686/720), 12.36 Lakh Qualified Complete Analysis, Cutoff & Counselling Guide
Optional Subject Analysis What the Data Says
Humanities optional subjects deliver 84.1% of successes dwarfing Science (10.2%) Engineering (3.4%) and Medical (2.3%).
| Optional Subject Type | % of Successful Candidates |
|---|---|
| Humanities | 84.1% |
| Science | 10.2% |
| Engineering | 3.4% |
| Medical | 2.3% |
Most popular humanities optionals among toppers:
- Political Science & International Relations (PSIR)
- Sociology
- Anthropology
- History
- Public Administration
- Philosophy
- Geography
The apparent paradox: 71% of selected candidates have Science/Engineering backgrounds but 84% of selections come through Humanities optionals. This means most SEM-background candidates strategically choose Humanities optionals especially PSIR Sociology Anthropology rather than their graduation subjects.
State Wise Performance Who Sends the Most IAS Officers?
Uttar Pradesh (UP) always takes the lead in the number of toppers in the UPSC Civil Services. The state’s dominance in producing the highest UPSC success is evident with prominent performers such as Shruti Sharma (AIR 1, 2021) and Aditya Srivastava (AIR 1, 2023).
| State/Region | Performance Level | Notable |
|---|---|---|
| Uttar Pradesh | Consistently #1 | Most selections, most toppers |
| Rajasthan | Very High | Anuj Agnihotri AIR 1 (2025) |
| Bihar | High | Strong coaching culture |
| Delhi (NCR) | High | Hub of UPSC coaching institutes |
| Tamil Nadu | Significant | High technical background |
| Maharashtra | Significant | Large population advantage |
| Karnataka | Moderate-High | Growing presence |
| Andhra Pradesh/Telangana | Moderate | Strong engineering base |
In 2017-18 there were 17 aspirants from Delhi and 12 from Bihar who got selected to the Indian Administrative Services. Tamil Nadu had around 8 and Karnataka approximately 6.
Why UP dominates: UP holds the largest number of approved IAS positions totalling 652 out of which 548 are working indicating its large input in the country concerning administration. Combined with a culture that deeply values civil services as a career and a large aspirant population UP consistently produces the most selections.
Also Read: JoSAA 2026 Round 1 Seat Allotment Result OUT Live: Check at josaa.nic.in, Opening & Closing Ranks
Year Wise UPSC Final Results Toppers and Vacancies
AIR 1 marks usually range between 1,050 and 1,126 out of 2,025.
| Year | AIR 1 | State | Score | Vacancies |
|---|---|---|---|---|
| 2025 (CSE) | Anuj Agnihotri | Rajasthan | — | 1,009 |
| 2024 | Shakti Dubey | Uttar Pradesh | 1,043 | 1,056 |
| 2023 | Aditya Srivastava | Uttar Pradesh | — | 1,016 |
| 2022 | Ishita Kishore | Uttar Pradesh | — | 933 |
| 2021 | Shruti Sharma | Uttar Pradesh | — | 712 |
| 2020 | Shubham Kumar | Bihar | — | 796 |
Vacancy trend: UPSC CSE vacancy notifications vary each year. Recent vacancy counts 2024 (1,056), 2023 (1,016), 2022 (861), 2021 (712), 2020 (796), 2019 (927). The 2024 notification of 1,056 vacancies represents a significant increase driven partly by backlog filling and expansion of IPS and IFS cadres.
The Pre 2013 vs Post 2013 Comparison
Before 2013 Success rate was 1 in 365 aspirants. After reforms Success rate dropped to 1 in 1,215 aspirants.
| Period | Success Rate | Key Change |
|---|---|---|
| Before 2013 | 1 in 365 candidates | No CSAT fewer applicants |
| After 2013 reforms | 1 in 1,215 candidates | CSAT introduced applicant pool exploded |
The 2011 CSAT introduction and subsequent reforms significantly increased the difficulty and reduced the success rate as the aspirant pool expanded dramatically while vacancies did not grow proportionally.
UPSC vs World How Does It Compare?
The UPSC Civil Services Examination is frequently cited as one of the three most competitive examinations in the world alongside the Chinese National College Entrance Examination (Gaokao) and South Korea’s CSAT.
| Exam | Country | Applicants | Selected | Success Rate |
|---|---|---|---|---|
| UPSC CSE | India | 11 lakh | 1,000 | 0.1% |
| Gaokao | China | 12 million | University admission | 50–60% |
| Korean CSAT | South Korea | 500,000 | University admission | 60–70% |
| JEE Advanced | India | 1.8 lakh | 56,000 | 31% |
| NEET UG | India | 22 lakh | 1,09,000 (MBBS) | 5% |
UPSC is in a class by itself the 0.1% final success rate is significantly lower than any other major examination in India or globally for a similar career path.
Also Read: JoSAA 2026 Mock Allotment Round 2 OUT LIVE: Choice Filling Last Date, Full Schedule
What Should Aspirants Take Away From This Data?
1. First attempt failure is normal not disqualifying
Only 6.2% cleared UPSC on their first attempt. If you failed Prelims 2026 you are in the company of 93.8% of eventual IAS officers.
2. The 3rd and 4th attempts are your peak window
Data consistently shows the 3rd and 4th attempts produce the highest success rates. Start early (21–22), use the first attempt as a diagnostic, and build toward a peak at attempts 3–4.
3. Engineering/Science background + Humanities optional = winning formula
71% of selected candidates have SEM background but most choose Humanities optionals. If you have an engineering background strongly consider PSIR Sociology or Anthropology as optional subjects.
4. Women are outperforming the gender gap is closing
With a 31.9% female success rate vs 27.1% male at the peak age band female aspirants should recognise they have a statistical advantage once they reach the interview stage.
5. You don’t need a postgraduate degree
25% of selected candidates are postgraduates but 75% are graduates. A PG degree delays entry into preparation and uses up precious years from your attempt window.
UPSC 2026 Where Things Stand Right Now
Current status as of June 2026
- Prelims result declared June 15, 2026 13,343 qualified for Mains
- Mains scheduled August 21, 2026 onwards
- DAF submission June 19–28, 2026
- Final result expected early 2027
For the 13,343 who cleared 2026 Prelims you are among the top 2.43% who cleared Stage 1. The Mains is where the real differentiation happens answer writing quality Optional subject depth and GS breadth across 1,750 marks will determine who makes the final cut from here.
Frequently Asked Questions (FAQs)
Q1. What is the UPSC success rate? The UPSC Civil Services overall success rate is approximately 0.1% 0.18% of candidates who appear for the Prelims. Of every 1,000 registered candidates approximately 1 is finally recommended.
Q2. How many attempts does it take to clear UPSC? The 4th attempt has the highest success rate among selected candidates. Only 6.2% of IAS officers cleared on their first attempt. 93% required multiple attempts. The average has increased from 2–3 attempts pre-2014 to 3–4 attempts today.
Q3. What percentage of UPSC candidates clear Prelims? Approximately 2.4–2.5% of candidates who appear for UPSC Prelims clear it to qualify for the Mains examination.
Q4. Do more engineering students clear UPSC than arts students? By background 71% of selected candidates come from Science/Engineering/Medical streams. However 84% use Humanities optional subjects meaning most SEM-background candidates strategically switch to Humanities optionals for better scoring.
Q5. Which state produces the most IAS officers? Uttar Pradesh consistently produces the highest number of IAS officers and UPSC toppers. Rajasthan, Bihar, Delhi NCR, Tamil Nadu and Maharashtra are other major contributing states.
Q6. Do women perform better than men in UPSC? Yes. Female success rate at peak age band is 31.9% vs 27.1% for males. Women comprised 34.4% of final selections despite being a smaller percentage of total applicants.
Q7. What is the best age to crack UPSC? The 24–26 age group has the highest success rate. This corresponds to the 3rd 4th attempt for candidates who start preparing at 21–22 after graduation.
Q8. How has the UPSC success rate changed over time? Before 2013 the success rate was 1 in 365 aspirants. After the 2011 CSAT reforms and expansion of the applicant pool it dropped to 1 in 1,215 a more than 3x decrease in probability.
Q9. How many people appear for UPSC every year? Approximately 10–13 lakh candidates register for UPSC CSE annually of whom 4.5–5.8 lakh actually appear for Prelims. In 2026, 8.19 lakh registered and 5.49 lakh appeared.
Q10. Is UPSC the toughest exam in the world? UPSC CSE is widely considered one of the three most competitive examinations in the world with a final success rate of 0.1% compared to approximately 50–60% admission rates for major university entrance exams globally.
Last Updated: June 20, 2026 | Sources: UPSC Annual Reports (upsc.gov.in)
Author Profile
- Abdul is a Passionate Content Writer at ZeroToScaled, Covering the Latest Updates on Education, Board Results, Recruitment News, He Focuses on Creating Simple, Accurate and User Friendly Content that Helps Readers Stay Updated with Important Announcements.
Latest entries
 Admit CardJune 22, 2026UPTET Exam City Slip 2026 Released: Download at upessc.up.gov.in, Exam July 2–4, Admit Card June 30
 Education NewsJune 22, 2026UPSC Success Rate 2026: The Shocking Percentage of Aspirants Who Finally Become IAS Officers
 Sarkari JobJune 21, 2026BPSC 70th Final Result 2026 Released! Download Merit List PDF & Check Your Selection Status
 Education NewsJune 20, 2026JEE Advanced Cutoff 2026: Category-Wise Qualifying Marks, Safe Score & IIT Admission Analysis